On February 11, 2016, the Baltic Dry Index (BDI) traded to an all-time low of 290. On the same day, the split-adjusted price of DryShips Inc. (NASDAQ:DRYS) was around $1200 per share. Fast forward to February 7, 2017, and the BDI has appreciated to $735 while DRYS is trading $4.80 per share. DRYS has declined by 99.6% while the BDI has more than doubled. Shipping is a very volatile business.
Shipping dry bulk commodities around the world is a seasonal and a demand-based business. In late 2015 and early 2016 the prices of many raw materials fell to multiyear lows. Gold and silver reached multiyear lows in December 2015. Copper fell to its bottom in January 2015 alongside iron ore, many of the base metals that trade on the London Metals Exchange, and many other metals and minerals. In February of 2016, the price of oil dropped to the lowest level since 2003 when it traded to $26.05 on the nearby NYMEX futures contract and in March natural gas futures posted their lowest price since 1998 at $1.611 per MMBtu.
Since last year’s lows, almost all raw material prices have posted impressive gains. Even shipping rates moved higher throughout 2016. However, lately the BDI has been dropping and the price of DRYS has been nothing less than a one-way street lower.
Why is the BDI dropping?
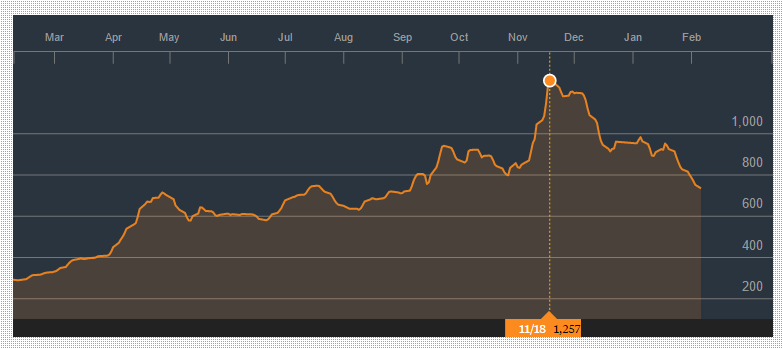
Since November 18, 2016, the Baltic Dry Index has tanked. Source
As the chart shows, the move from 1257 in the middle of November to the current level of 735 has been dramatic. However, under closer inspection, the BDI tends to move to lows in February.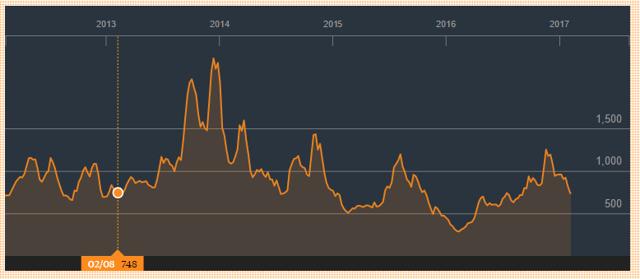
Source
The longer term chart illustrates that the dry bulk shipping index made lows of 748 in February 2013, 1091 in February 2014, 513 in February 2015 and 290 in February 2016. The pattern of lows in February likely reflects the slowdown of shipping activity in the Northern Hemisphere during the winter months. Therefore, we should expect a recovery in the shipping index in the months ahead. Meanwhile, at 735, the index has moved 41.5% lower since the middle of November but is still 153% above the level last year at this time.
DRYS a very ugly chart
DryShips Inc. is a company that attracts massive trading volume. On Tuesday, February 7, the stock traded a total volume of over 57.2 million shares and just under 10 million shares change hands on an average trading day. Source: Barchart
On a split-adjusted basis, DRYS traded at highs of $1,576,080 per share in October 2007 and was trading at under $5 on Tuesday. The 52-week range in DRYS has been from $1.97 to $2,237.20 per share which makes me wonder why anyone would invest in this company. I guess the volatility of the stock makes it a trading sardine for those looking for action in the market.
Shipping is a rough business once again
Commodities are volatile assets when it comes to prices but even the most volatile commodities in the world cannot compare to volatility in the shipping stocks.
Last year, when oil was on its way to its lowest price since 2003, the contango in oil moved to over 25% on one-year spreads for a while. The wide contango caused an increase in demand for oil shipping. China increased its strategic petroleum reserve which caused the energy commodity to flow from the Middle East and other producing nations to Asia. However, the spike in demand for oil tankers was supported by the contango.
Traders around the world with access to capital bought physical crude oil and sold deferred contracts at over a 25% premium. So long as all of the costs of the cash and carry trade did not exceed 25%, the traders locked in a profit. Those with low capital costs who were able to negotiate attractive storage deals with the shipping companies that owned tankers profited handsomely from the trade. However, this year, the spreads between nearby and deferred oil are dramatically lower when compared to levels seen last year. Source: CQG
As the chart of the June 2017 versus June 2018 NYMEX crude oil spread highlights, the contango was trading at the $1.14 per barrel level on February 7. The contango of 2.1% does not support any cash and carry trades and as the spread moved to a backwardation in December, it is likely that many of those holding trades put on at a contango above the 20-25% level have already unwound those positions for a healthy profit. The unwind is one of the reasons that demand for shipping that was growing last year at this time has declined, dramatically. However, when it comes to shipping there is a reason to be positive for a rebound in rates in the months ahead.
Infrastructure building in the U.S. could cause a surge
On the campaign trail, President Trump pledged to rebuild America’s crumbling infrastructure. If Congressional legislation approves a major infrastructure rebuilding project the demand for the basic building blocks will increase. Metals, minerals and energy demand is likely to cause these raw materials to make their way around the world from points of production to regions that require them for construction. Therefore, we may be seeing a lull in shipping right now during the dead of winter of 2017 but that could end if the President of the United States fulfills his promise to be the builder-in-chief of the nation during his term.
Meanwhile, the demand for shipping will likely reach its nadir for the year during this month.
A seasonal market for dry bulk cargoes
The fact that the BDI has made seasonal lows in February in the past three years is a sign that things are likely to pick up in the months ahead.
When I look at the action in DryShips stock I have to stop, scratch my bald head and wonder why anyone in their right mind would invest in this company. DRYS has become nothing but a number on the screen that moves around and inevitably goes lower. While I expect shipping activity to pick up starting in March, I would steer clear of this shipping company. Meanwhile, perhaps the best way to play the seasonal lull in shipping demand is to look for price weakness to buy industrial commodities over the coming weeks.
We have already seen signs that the path of least resistance for dry bulk commodities remains higher. Source: CQG
The weekly chart for lumber futures shows that one of the basic building blocks for construction is trading at the highest price since March 2014. Source: CQG
The weekly chart of Dr. Copper highlights that the red metal broke out to the upside in November and remains closer to highs than technical support. Crude oil is almost double the price it was trading at last year at this time and most other commodities that are staples when it comes to building are trending to the upside. Therefore, if the richest nation in the world starts rebuilding roads, bridges, tunnels, airports, rail systems and constructs a security wall along the southern border, expect staple commodity prices and shipping rates to pick up from current levels.
I am bullish on the Baltic Dry Index at its current level but as far as DRYS is concerned, I will leave that speculative puppy to the day traders who seem to be playing that stock as a casino game rather than a shipping company.
I have introduced a new weekly service through Seeking Alpha Marketplace. Each Wednesday, I will provide subscribers with a detailed report on the major commodity sectors covering over 30 individual commodity markets, most of which trade on U.S. futures markets. The report will give an up, down or neutral call on these markets for the coming week and will outline the technical and fundamental state of each market. At times, I will make recommendations for risk positions in the ETF and ETN markets as well as in commodity equities and related options. You can sign up for The Hecht Commodity Report on the Seeking Alpha Marketplace page.